Blog by 4D-Reef ESR Xin Ren, based at University of Bristol.
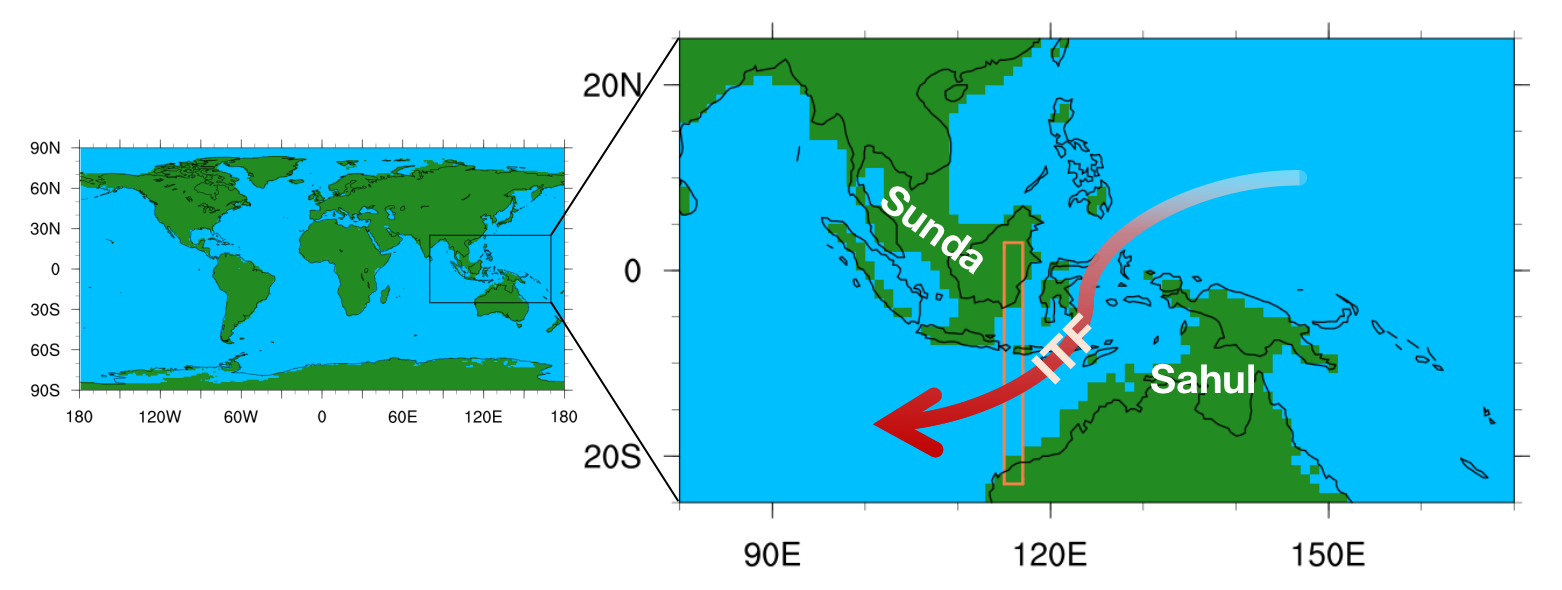
Figure 1 (at top of the page). PRISM4 Pliocene land-sea mask. The modern continental outline is indicated with black lines; blue and green shadings indicate ocean and land in the mPWP experiment. The red rectangle indicates the location of the Timor passage of the Indonesian Throughflow (ITF). The red arrow denotes the position and direction of the ITF illustratively. The Sunda and Sahul shelves are illustrated in this figure via white labels. The continental outline is constructed from (Dowsett et al. 2016) and retrodicted with a set of procedures based on the paleogeographic maps of (Markwick 2007).
Recently, I, Xin, explored the simulated climate of the Maritime Continent during the mid-Piacenzian period. The results will be published in my recent paper “The hydrological cycle and ocean circulation of the Maritime Continent in the mid-Pliocene: results from PlioMIP2” that is in preprint (https://doi.org/10.5194/egusphere-2022-1281).
In this study, I used the Earth System Models to understand the hydrological cycle and ocean circulation of the Maritime Continent under this high CO2 concentration induced warm period. The results provide us with a comprehensive and quantified sight into the changes in sea surface temperature, freshwater flux, salinity, wind stress and throughflow of the coral triangle, which can play an important role in coral reefs ecosystem.
Bullet points:
- In the mid-Piacenzian warm period, the climate of the Maritime Continent was warmer and wetter and the sea surface salinity in the surrounding ocean was lower compared with preindustrial.
- In terms of the Indonesian Throughflow, 10 out of 15 models show an increased volume transport in the mid-Piacenzian warm period compared with preindustrial.
The Maritime Continent (MC) forms the western boundary of the tropical Pacific Ocean. The Indonesian Throughflow (ITF) via the Maritime Continent is a key component of global ocean circulation. The ITF links the Pacific Ocean and the Indian Ocean by transporting warm and comparably fresh water from the Pacific Ocean into the Indian Ocean. Dramatic tectonic processes and sea level changes shaped this gateway that plays an important role in influencing local climate and that of other regions of the world. In the mid-Piacenzian warm period of the Pliocene (mPWP; 3.264 to 3.025 million years ago) atmospheric CO2 concentrations were ~400 ppm, and the subaerial Sunda and Sahul shelves made the land-sea distribution of the MC different to today (Fig 1- top of the page). Topographic changes and elevated levels of CO2, combined with other forcings, are therefore expected to have driven a substantial climate signal in the MC region at this time.
By using the results from the Pliocene Model Intercomparison Project phase 2 (PlioMIP2), we study the mean climatic features of the MC in the mPWP and changes in ITF with respect to preindustrial. In this study we adopt the E280 simulation as a control experiment, which is forced with preindustrial conditions, and the Eoi400 simulation as a sensitivity experiment for mPWP conditions, which is forced with all mPWP boundary conditions; these are topography, ice sheets, soil, vegetation, lakes, land-sea mask and a concentration of 400 ppm of CO2 in the atmosphere. The boundary conditions for the PlioMIP2 experimental design can be downloaded from https://geology.er.usgs.gov/egpsc/prism/7.2_pliomip2_data.html.
As shown in Fig 2, in line with the global climate, all the 17 PlioMIP2 models show higher SSTs in the mPWP MC, ranging from +0.43°C to +3.33°C, with a MMM warming by 1.88°C; 13 out of 17 models show fresh water flux increased in the MC, the anomaly ranging from +0.04 mm/day to +0.50 mm/day. In terms of atmospheric circulation, the easterlies over the western tropical Pacific Ocean show enhanced intensity in the MMM; there is anomalous eastward wind stress over the ocean near Western Australia. Seawater salinity affects the thermohaline circulation; 14 out of 16 models (model MRI-CGCM2.3 is absent here) show a lower SOS in the MC.
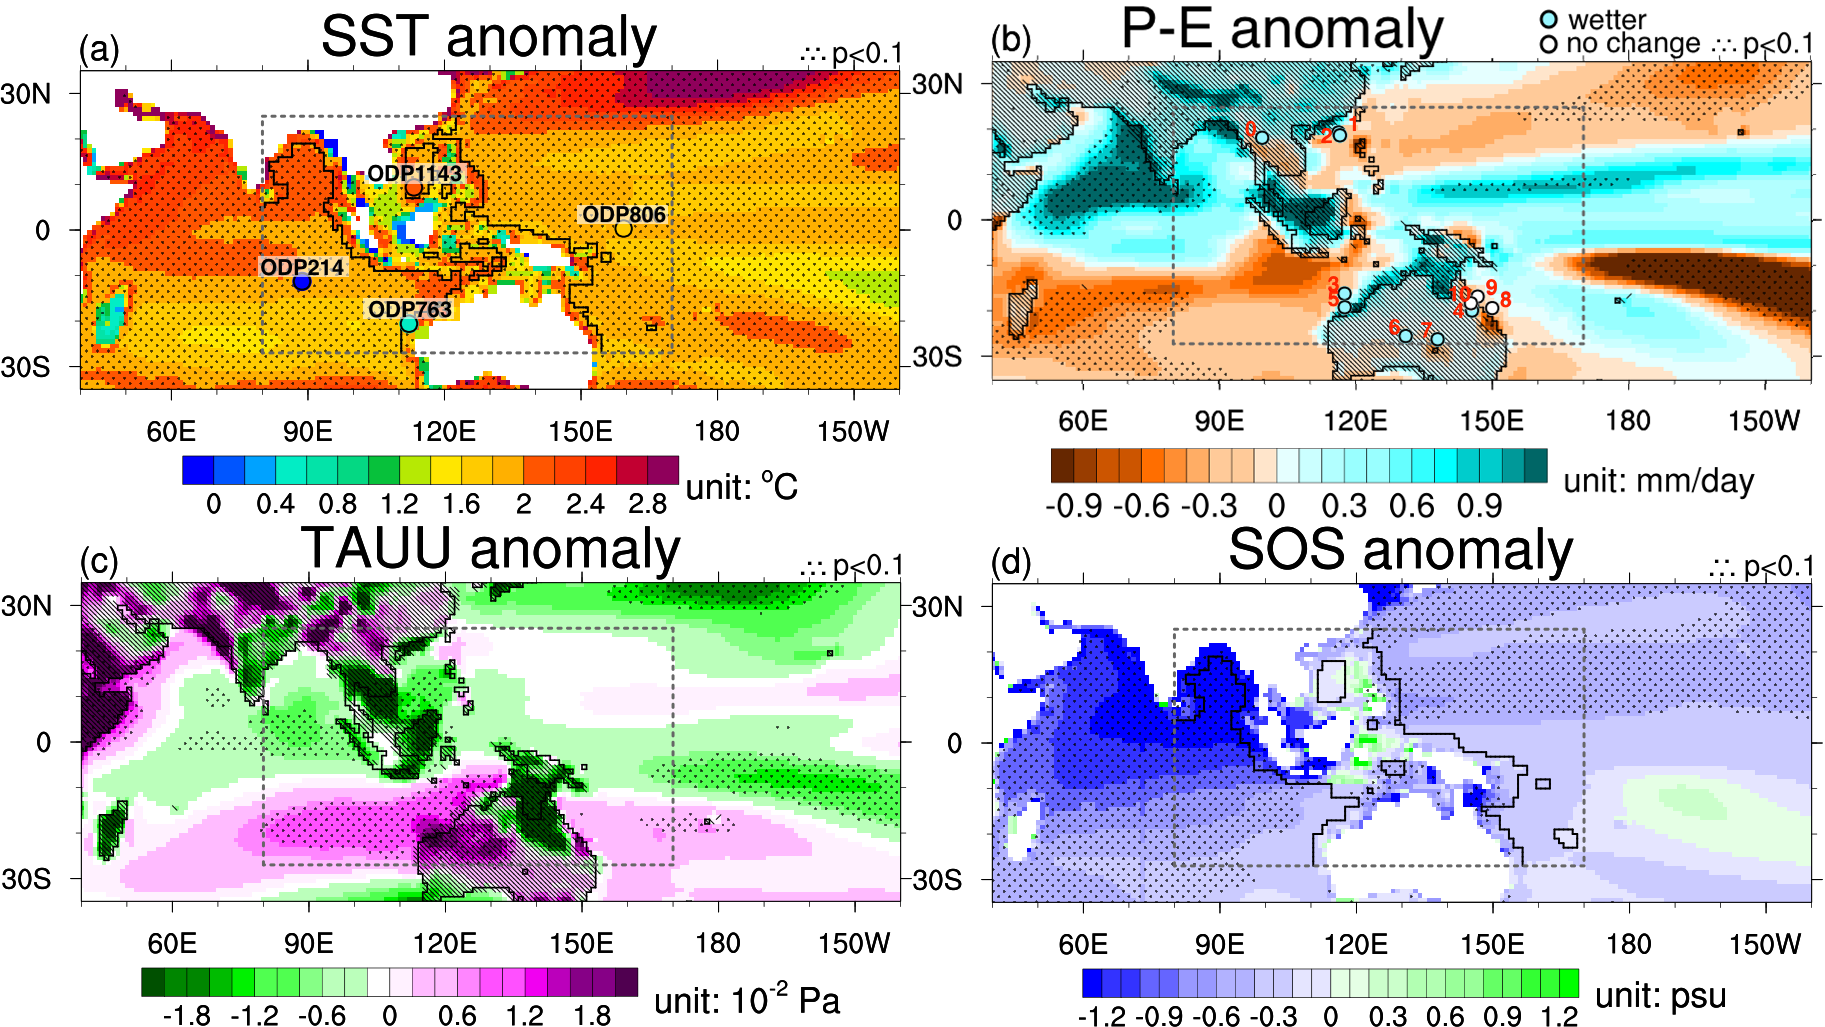
Figure 2. The MMM anomalies over the MC in the mPWP simulation relative to the preindustrial simulation for (a) sea surface temperature (SST), (b) precipitation minus evaporation (P-E), (c) zonal surface wind stress (TAUU) and (d) salinity at the ocean surface (SOS). In (a), circles mark the location of the SSTA proxies. Their colour represents the reconstructed SSTAs, the name of each site is indicated on the top of each circle. In (a) and (d), white shading indicates the grid boxes that are land for all the models, grid boxes outside the black lines are ocean grid boxes for all the models. In (b) and (c), hatches indicate land grid boxes in the mPWP experiment; the black lines indicate the continental outlines of the preindustrial experiment. In (b), filled circles denote proxy data in terms of wetter, or no-change condition. Details of each numbered site are shown in Table S2 in the supplement of the original paper. In (c), green shading indicates westward anomaly and purple shading indicates eastward anomaly. Stippled areas show significant multi-model differences according to a t-test at the 90% confidence level.
Temperature and density differences are factors that can contribute to changes in the ITF, which is an important process for regulating the climate of the MC. Therefore, we quantify and investigate the changes of oceanic flow through the MC in the mPWP. Even though the topography of the MC in the mPWP acts as a barrier for volume transport between the Pacific Ocean and the Indian Ocean compared to the preindustrial, 10 out of 15 models show the ITF intensity increasing by 5.6% to 43.8%. CESM2, IPSL-CM6A-LR, COSMOS, MIROCm4 and HadGEM3 show a decrease in intensity of the ITF, the amplitude of westward flow is here lowered by 3.4% to 39.4% (Fig 3b).
The spatial pattern of the vertical integrated zonal seawater volume transport anomaly is shown in Fig. 3a. There is a westward transport anomaly along the northeastern coast of the New Guinea, which favours the ocean mass transport of the ITF. For the oceanic transport through the gateway, the westward water transport via Timor passage has been strengthened over the north, but weakened over the south in the mPWP compared to the preindustrial. Moreover, the water mass is mainly transported through the ITF in the ocean above 1000 meters depth in both the preindustrial and the mPWP. The changes in the volume transport of ITF also mainly occur in the ocean above 1000 meters depth.
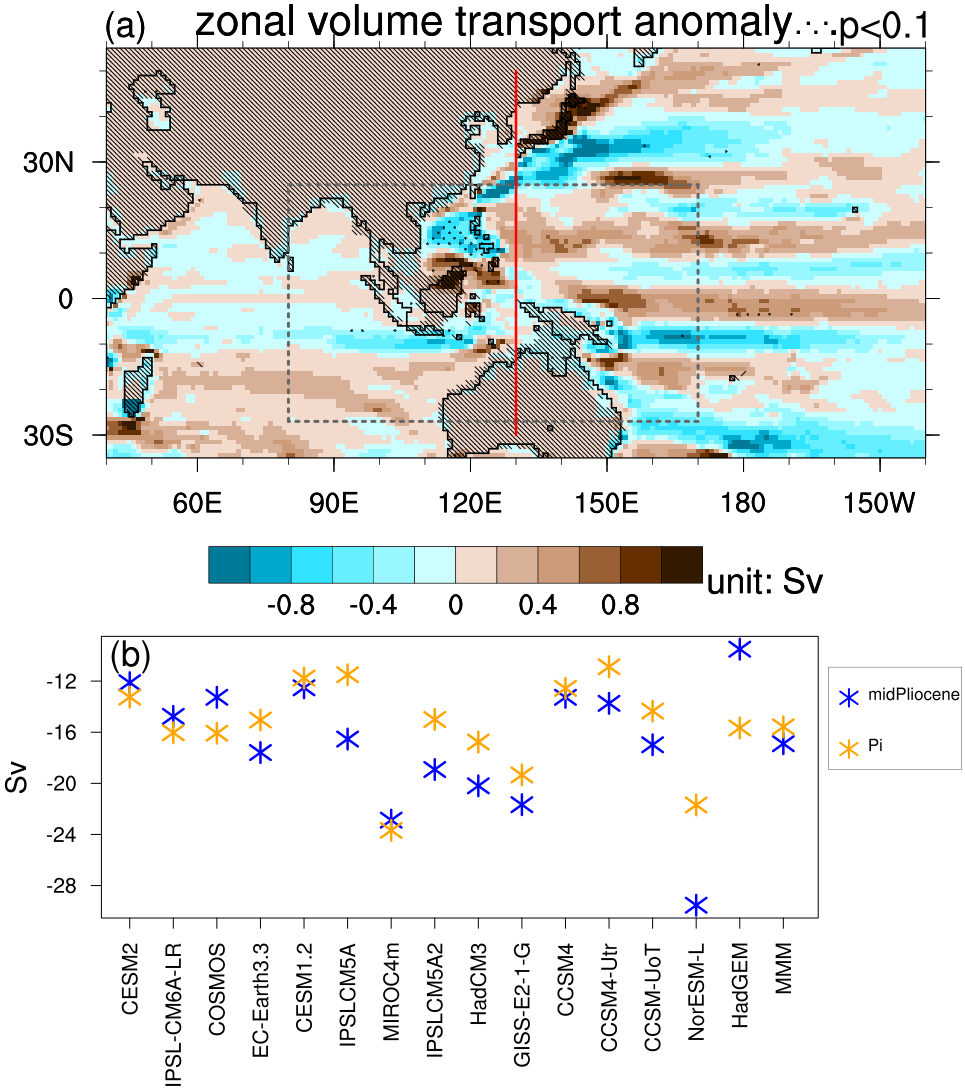
Figure 3. (a) The MMM zonal seawater volume transport anomaly in the mPWP experiment relative to the preindustrial experiment. Blue shading indicates westward anomaly and brown shading indicates eastward anomaly. The red line is the transect to calculate the ocean volume transport intensity in (b). The hatches indicate land grid boxes in the mid-Pliocene experiment; the black lines indicate the continental outlines of the preindustrial experiment. (b) The integrated ocean volume transport intensity through the gateway. Negative values indicate westward transport. Stippled areas show significant multi-model differences according to a t-test at the 90% confidence level.
References:
Dowsett, H., and Coauthors, 2016: The PRISM4 (mid-Piacenzian) paleoenvironmental reconstruction. Clim. Past, 12, 1519–1538, https://doi.org/10.5194/cp-12-1519-2016.
Markwick, P. J., 2007: The palaeogeographic and palaeoclimatic significance of climate proxies for data-model comparisons. Geol. Soc. Spec. Publ., 251–312, https://doi.org/10.1144/tms002.13.