Blog by Daniel Christoph Schürholz, PhD student of 4D-REEF at the Max-Planck-Institute for Marine Microbiology.
The current global pandemic has affected all of our personal and professional lives. I myself started my PhD project two and a half years ago with quite a different plan than what ended up playing out. Especially the field work in the Spermonde Archipelago in Indonesia has been repeatedly scratched off the calendar, and no certain schedule is yet in place, despite the great efforts of the organization committee. But we adapt, and with a good and supportive team of colleagues we find ways to produce interesting results in these difficult times. Luckily, this has also been the case in my PhD project, in which we are using previously collected datasets and “plastic” coral reefs to continue developing our coral reef surveying tools.
The evolution of underwater coral reef monitoring
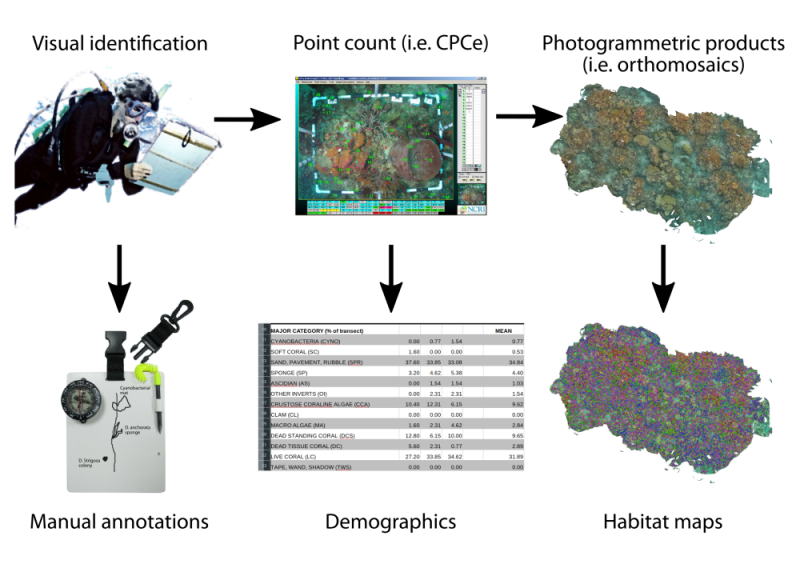
For a bit of context: my project has the aim of surveying the seafloor communities in coral reefs. Underwater surveying started with ecologists visually identifying the organisms they encountered as they dived along the coral reefs. This process is still used in certain studies, because of the detailed descriptions. However, it is a slow process and heavily dependent on the expert’s knowledge of the local flora and fauna, with different experts focusing on some organisms more than others, or just lacking the experience to make a detailed assessment. To tackle these issues, scientists started using underwater photography to speed things up and quickly scan the seafloor. They do so by taking images of rectangular plastic frames overlaid on the reef floor. Then with image annotation software, experts give labels to randomly sampled points (generally between 5 and 25) on dozens or hundreds of the images. The percentage cover of different organisms in the reef is then calculated (i.e. corals cover 20% of this reef and sponges cover 5%). This method is called point count and is widely used in ecological surveys of the seafloor. But what we are missing with these surveying techniques is a detailed spatial representation of the organisms, their surroundings and their distribution. In other words we are missing a thematic habitat map of the seafloor. It is similar to describing a country only by the percentage of the world’s landmass it covers (i.e. Canada – 6.1%, India – 2.0%, Peru – 0.9%), instead of producing a geopolitical map that shows the sizes and shapes of countries, their access to bodies of water or neighboring countries. The analyses you could do with both methods are quite different.
With this in mind, researchers are using state-of-the-art technologies to automatically produce maps of terrestrial and marine habitats. Recent improvements in underwater photography, for example, with new diver operated devices, remotely operated vehicles and autonomous underwater vehicles , are producing a massive stream of new image data of underwater environments, such as coral reefs. Furthermore, structure-from-motion software enables stitching these underwater images together to form large and uninterrupted top-down views of the seafloor, called orthomosaics. However, to transform all these images and orthomosaics into habitat maps, experts still have to manually contour all organisms and objects in the images, then identify them and finally assign labels to them. This is a critical bottleneck in underwater monitoring and thus automating the map production process in a scalable manner is a necessity. Here enters machine learning (ML), more specifically, supervised learning. In supervised learning, an algorithm teaches computers to recognize certain patterns in the images (from textures and shapes in regular color images) and return a label for the whole image, or (more interestingly) one label for each pixel in the image, creating a dense habitat map of the coral reef seafloor.

Figure 1. Simplified evolution of underwater mapping methods and the results in each case.
Adapting to the lack of field work
In my project we use a diver-operated device called the HyperDiver (HD), to acquire underwater hyperspectral images of coral reefs that are then used to produce detailed habitat maps. Hyperspectral images are like regular color images, but instead of capturing the usual 3 color bands (RGB) they capture many more (up to 400 with the HD) bands in the visible light range. The HD’s hyperspectral camera is a line-scanner, meaning that successive lines of 640 pixels wide are taken as the diver pushes the device forward, basically scanning the reef in long transects. The rich data in each transect supplies the ML algorithm with around 130 times more spectral information to identify targets in the images, instead of relying only on textures and shapes. This allows the ML to predict detailed labels for each pixel in the image, for example organisms can be recognized down to species level and different substrate types can be differentiated (turf algae, sediment, cyanobacterial mat).
We developed a whole pipeline to produce these detailed habitat maps with ML algorithms from HD data. And since we have not been able to reach Indonesia, we tested our workflow with a “pre-pandemic” dataset, acquired in the Caribbean island of Curacao in 2016 by my supervisor Arjun Chennu. We found that the workflow produces accurate habitat maps from the images of coral reefs. I am currently working on describing the habitat structure and the biodiversity of the coral reefs of Curacao using these maps. Despite the great accuracy of the maps, one methodological caveat in the acquisition of the transects still remains. Namely that the transects form a barred grid of the reef with a one meter gap between each two parallel transects to reduce the redundancy produced by the overlap of the transects. This would be no issue if the transect images could be stitched together, but (because of methodological issues) this is not so straightforward. To solve this problem we have now expanded the HyperDiver’s imaging arsenal to capture color images that can be stitched together to produce orthomosaics, and then register the hyperspectral images on top of them.

Figure 2. Example section from a transect’s habitat map from the Curacao dataset. Corals (yellow, orange and pink), macroalgae (light and dark green), turf algae (olive), sediment (cream), sponges (blue), coralline algae (red) and even cyanobacterial mat (purple) are accurately classified in the hyperspectral transect.

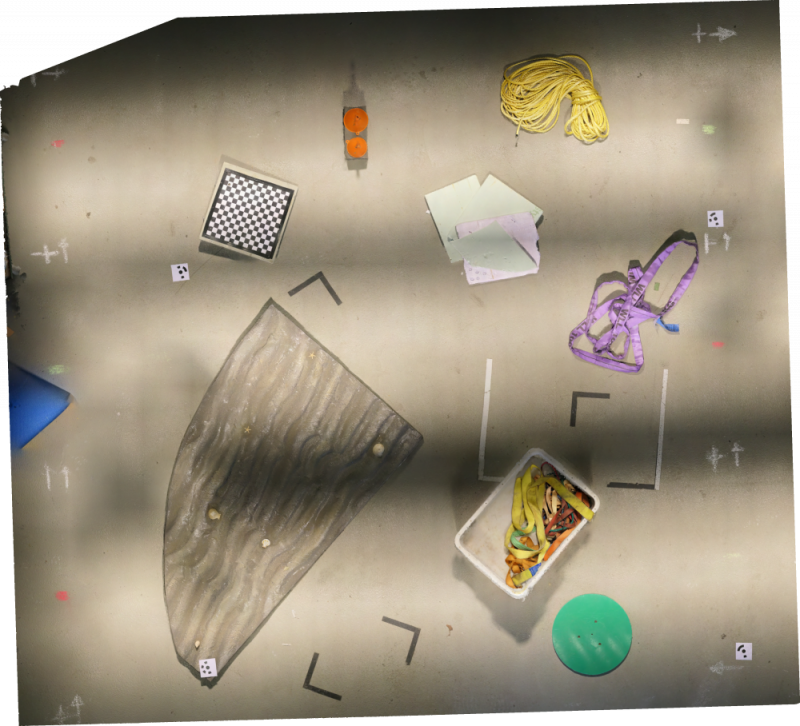
Figure 3. Orthomosaic of “plastic corals” at the warehouse at the MPIMM. The orthomosaic was created using structure-from-motion software on images from the new color cameras added to the HyperDiver.
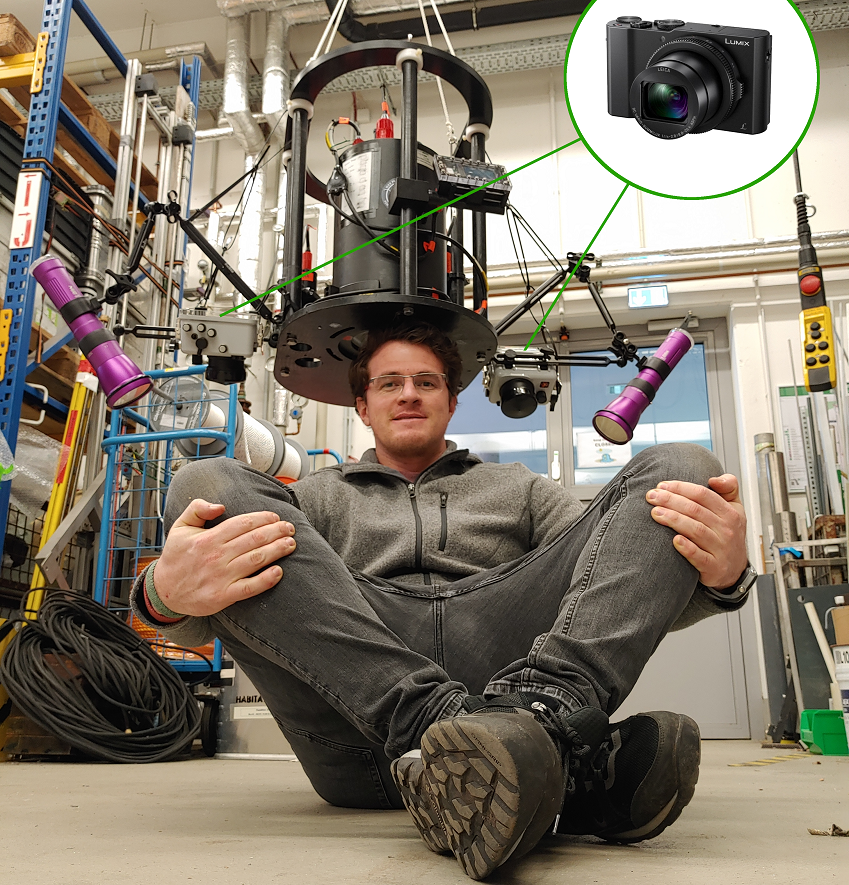
We have equipped two ‘point-and-shoot’ color cameras on the exterior of the HD, facing down in slightly different angles. The images from these cameras will produce the basis to build an orthomosaic of the scene. Since testing the device in the field was not possible so far, we tried the new setting on dry land. For this purpose we found some materials in the warehouse of the Max Planck Institute for Marine Microbiology (where I am based) and laid them on the ground of a large rectangular space (around 10×10 meters). We then lifted the HD with a crane and simulated a dive, pushing it around and over our ‘plastic coral reef’. I had envisioned my first test of the HD in a completely different setting, but nonetheless I found it was a good introduction. Handling three devices (HyperDiver + 2 external cameras) was not easy, and doing it in a calm (and dry!) setting helped me get used to all the quirks of the process. After scanning the warehouse-floor, I downloaded all the images from the 3 devices and built the very first HD orthomosaic. I am looking forward to trying the HD underwater and capturing the first ‘wet’ orthomosaic with it.
Figure 4. When you cannot reach your field work site, scan plastic corals at your institute!
We keep on developing the HD capabilities and have recently added a new multispectral camera to its camera inventory; I will write about this in a future post. Finally, I am thankful for the help from everybody involved in the project, which has made it possible to adapt to the obstacles posed by a global pandemic and its consequences.


